
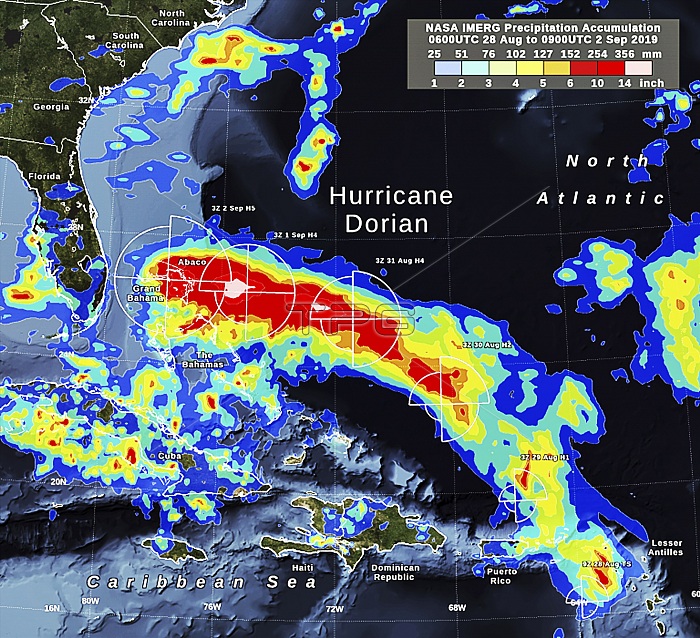
Hurricane Dorian rainfall track, satellite map. Red-white areas are where the largest amount of rain is falling (colour-coded scale at top right). The route of this hurricane through the Caribbean is shown from bottom right to upper left, with six circular overlays showing the extent from the storm's centre of tropical-storm force winds. The six overlays (one for each day from 28 August to 2 September 2019) are labelled with storm type and intensity: TS (tropical storm), H1, H2, H4 H4 and H5. Hurricane Dorian reached category 5 strength as it made landfall in the Bahamas where it caused extensive damage and flooding due to high winds, prolonged rainfall and storm surges. This map was compiled using data from NASA's IMERG algorithm, which combines GPM (Global Precipitation Measurement) observations from a fleet of satellites to provide global estimates of precipitation every 30 minutes.
| px | px | dpi | = | cm | x | cm | = | MB |
Details
Creative#:
TOP25065515
Source:
達志影像
Authorization Type:
RM
Release Information:
須由TPG 完整授權
Model Release:
N/A
Property Release:
N/A
Right to Privacy:
No
Same folder images:
 Loading