
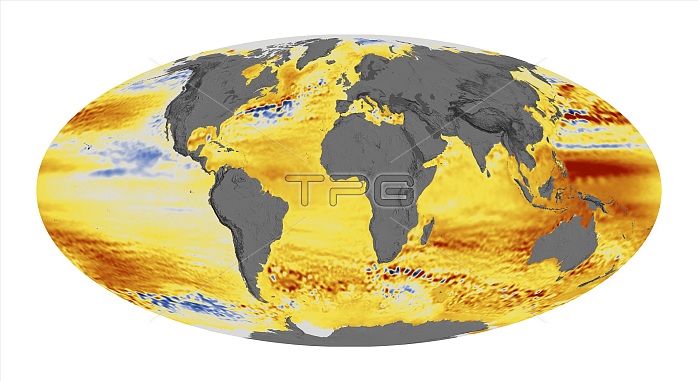
Global sea level rise. Global map, centred on Africa, showing the total sea level changes over 22 years between 1992 and 2014, based on satellite data. The colour-coding shows where sea level has gone down (blue) and where it has gone up (orange/red). The ranges shown is plus/minus 7 centimetres. Since 1992, seas around the world have risen an average of around 7 centimetres. Sea level rises, caused by melting ice caps, climate change and global warming, have devastating effects on low-lying and coastal communities. This data was obtained by the oceanography and ocean surface topography satellites TOPEX/Poseidon, Jason-1, and Jason-2.
| px | px | dpi | = | cm | x | cm | = | MB |
Details
Creative#:
TOP25373532
Source:
達志影像
Authorization Type:
RM
Release Information:
須由TPG 完整授權
Model Release:
N/A
Property Release:
N/A
Right to Privacy:
No
Same folder images:
 Loading