
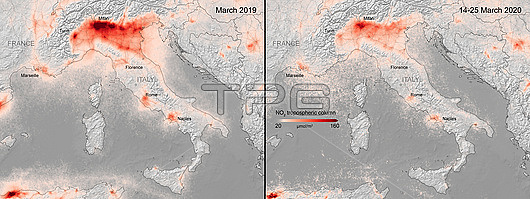
Satellite data map of the average nitrogen dioxide (NO2) levels in Italy between 14th and 25th March 2020 (right), during the 2019-20 Covid-19 outbreak, compared to the the monthly average of concentrations from 2019 (left). Nitrogen dioxide is a pollutant gas produced during industrial fossil fuel combustion and by road traffic. Quarantines to stop the spread of the new coronavirus, SARS-Cov-2, that is the cause of Covid-19 have lead to a reduction in NO2 emissions from both industry and traffic. Data obtained by the Tropospheric Monitoring Instrument (TROPOMI) on ESA's Sentinel-5 satellite.
| px | px | dpi | = | cm | x | cm | = | MB |
Details
Creative#:
TOP25752297
Source:
達志影像
Authorization Type:
RM
Release Information:
須由TPG 完整授權
Model Release:
N/A
Property Release:
N/A
Right to Privacy:
No
Same folder images:
 Loading