
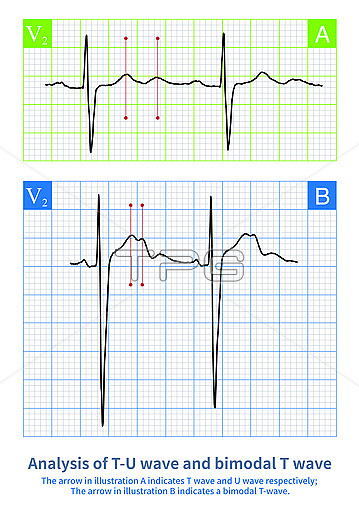
Electrocardiogram (ECG) illustration showing analysis of a U wave (top) and bimodal T wave (bottom). If the T-wave notch interval is greater than 150 milliseconds, the fusion of T-wave and U-wave is preferred. When it is less than 150 milliseconds, it tends to be interpreted as bimodal T wave.
| px | px | dpi | = | cm | x | cm | = | MB |
Details
Creative#:
TOP26664972
Source:
達志影像
Authorization Type:
RM
Release Information:
須由TPG 完整授權
Model Release:
N/A
Property Release:
N/A
Right to Privacy:
No
Same folder images:
 Loading