
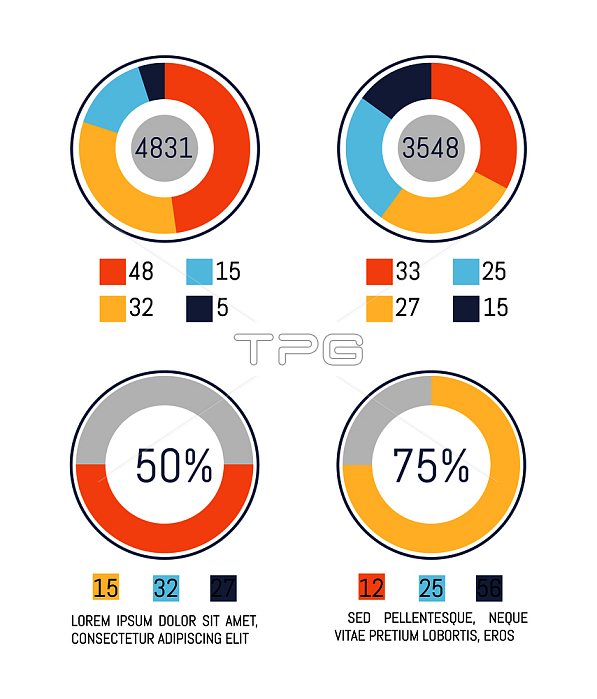
Infographic, pie diagrams business statistics representation vector. Schemes with numbers and data on analysis. Flowchart layout, graphics design. Infographic, Pie Diagrams Business Representation
| px | px | dpi | = | cm | x | cm | = | MB |
Details
Creative#:
TPG31175171
Source:
達志影像
Authorization Type:
RF
Release Information:
須由TPG 完整授權
Model Release:
No
Property Release:
No
Right to Privacy:
No
Same folder images:
Restriction:
eps檔
infographicinfochartflowchartchartvectorgraphgraphicschemepiediagramdesigntemplatepresentationdatalayoutstatisticinfographicsvisualizationillustrationeditablefigurecoloranalyzeorganizationtableresearchprojectstructuresearchexploreratereportnumberinformationbarplanningideainfocircleplanstrategyflatpartflowinvestigatelineexaminepieceinfographvisualInfographicpiediagramsbusinessstatisticsrepresentationvector.Schemeswithnumbersanddataonanalysis.Flowchartlayoutgraphicsdesign.InfographicPieDiagramsBusinessRepresentationING_47129_48151.jpgooopicapiimagedjapiguaranaapi
BusinessDiagramsFlowchartING_47129_48151.jpgInfographicInfographicPieRepresentationSchemesanalysis.analyzeandbarbusinesschartcirclecolordatadatadesigndesign.diagramdiagramseditableexamineexplorefigureflatflowflowchartgraphgraphicgraphicsguaranaapiideaillustrationimagedjapiinfoinfochartinfographinfographicinfographicsinformationinvestigatelayoutlayoutlinenumbernumbersonooopicapiorganizationpartpiepiepieceplanplanningpresentationprojectratereportrepresentationresearchschemesearchstatisticstatisticsstrategystructuretabletemplatevectorvector.visualvisualizationwith
 Loading