
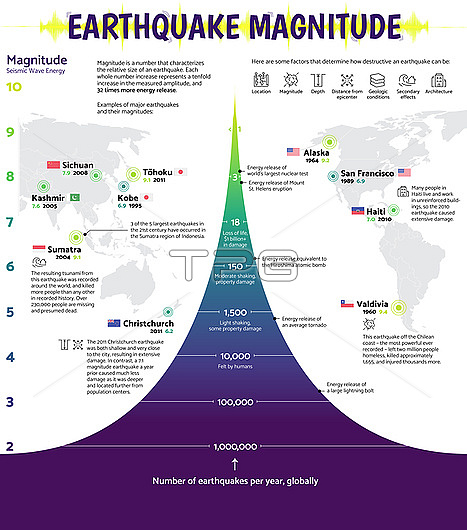
Infographic graph depicting the power and frequency of earthquakes. The horizontal width indicates the volume of earthquakes and the vertical height represents the magnitude. An earthquake's magnitude is measured from 1 to 10 (least powerful to most powerful) according to the Richter Scale. Over a million low powered earthquakes (rated 2 or below) occur each year. More powerful earthquakes are less common with an average of 18 at magnitude 7 and 3 at magnitude 8. Such earthquakes lead to destruction of buildings and loss of life. This image also highlights a few of the worst earthquakes in history. Data from the US Geological Survey.
| px | px | dpi | = | cm | x | cm | = | MB |
Details
Creative#:
TPG33842865
Source:
達志影像
Authorization Type:
RF
Release Information:
須由TPG 完整授權
Model Release:
n/a
Property Release:
n/a
Right to Privacy:
No
Same folder images:
 Loading