
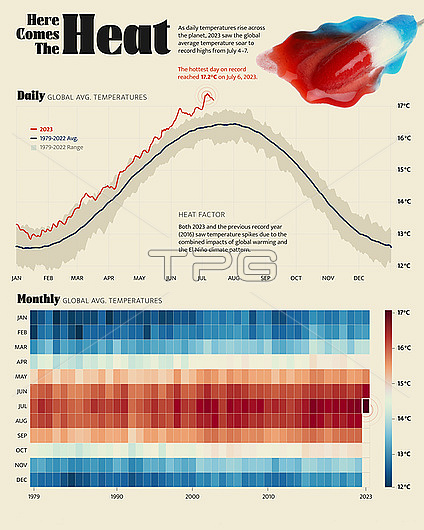
Infographic illustration showing global average daily (top) and monthly (bottom) temperatures in 2023 compared to the 1979 to 2022 average. 2023 was the hottest year in recorded history.
| px | px | dpi | = | cm | x | cm | = | MB |
Details
Creative#:
TPG34537459
Source:
達志影像
Authorization Type:
RF
Release Information:
須由TPG 完整授權
Model Release:
N/A
Property Release:
N/A
Right to Privacy:
No
Same folder images:
1900s2000s202320thcentury21stcenturyartworkaveragecelsiuscgichartclimatechangeclimatologicalclimatologydailydatadatavisualizationdigitallygeneratedearthscienceenvironmentenvironmentalscienceglobalglobalwarminggraphgraphicheathottestillustrationincreaseincreasinginfographicinfographicallabellabeledlabelledlabelsmonthlyno-onenobodyrisingtemperaturetemperaturestextvisualisationvisualizationwarmest
1900s2000s202320th21startworkaveragecelsiuscenturycenturycgichangechartclimateclimatologicalclimatologydailydatadatadigitallyearthenvironmentenvironmentalgeneratedglobalglobalgraphgraphicheathottestillustrationincreaseincreasinginfographicinfographicallabellabeledlabelledlabelsmonthlyno-onenobodyrisingsciencesciencetemperaturetemperaturestextvisualisationvisualizationvisualizationwarmestwarming
 Loading